|
|
|
|
Name
Cash Bids
Market Data
News
Ag Commentary
Weather
Resources
|

Walsh Pure Technicals - Pure Hedge Division
Jon Wiedeman 9/18/2025 If you would like to receive more information on the commodity markets or would like to open an account, please click the link Sign Up Now
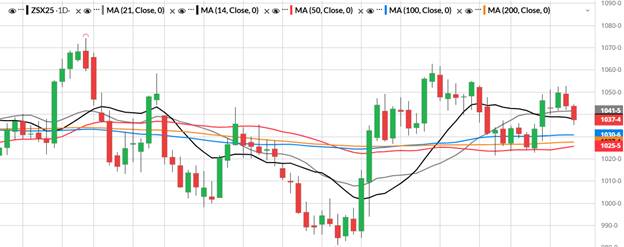
Daily ZSX5: November beans closed the day led by continuing weakness in soybean oil. Support seen in soybean oil off of the December contract comes in at 50.02 on the daily charts. We will watch and see if we get any fireworks going into the weekend with President Trump and Xi’s virtual meeting tomorrow. Support on the daily charts for Nov beans comes in at in at the 100-day moving average which is 1030 ¾ and then the few 50 day which is at 1025 ½. I am keeping a close eye on 1021 ½ which is the September 4th low. For resistance on the daily charts, we have 1052 ¾ then 1062 ¾. (see chart below)
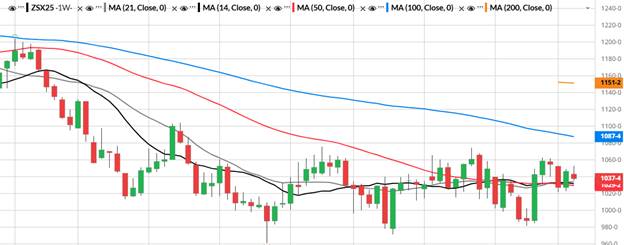
Weekly ZSX5: Looking at the weekly charts for November beans we have resistance at 1062 ¾ which was the month of August’s high and then followed by 1074 ¼. For support I am using 1029 ¼ which is the 50-day moving average on the weekly charts and then 1021 ½. (see chart below).
Fundamentals: Soybeans are anxiously waiting to get any sort of news coming from the virtual meeting between President Trump and Xi tomorrow. Exports were inline this morning and weather in the 6–10-day forecast continues to forecast a drying pattern which should be a good start for harvest. We will watch for harvest pressure in the markets as well as any signs of China coming back into the US markets for our soybeans. Trade Ideas: Long the 1050-1100 call spread in November beans for 10 cents.
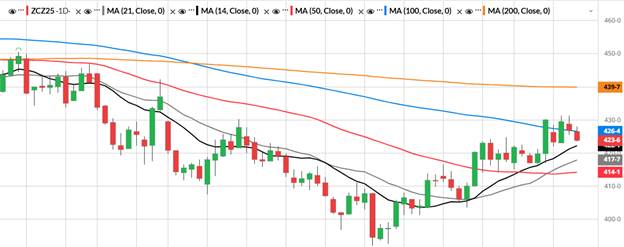
Daily ZCZ5: December closed lower on the day but still holding support of 422 which is the 14-day moving average. We have been closing above the 14-day moving average since August 18th so we will see if that continues to hold. I am using 414 which is the 50day moving average as well as support on the daily charts. For resistance we have a double top at 431 ¼ and then the July 3rd gap of 432 ¾. (see chart below).
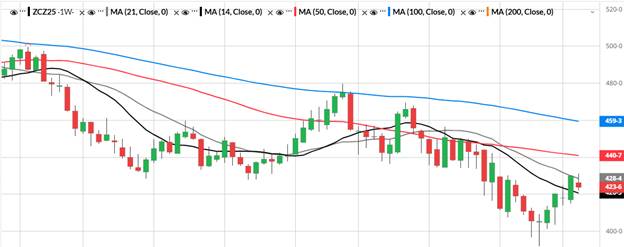
Weekly ZCZ5: Looking at the weekly charts for December corn we have resistance at 440 ¾ which is the 50-day moving average. For support I am using 415 which was last week’s low. (see chart below).
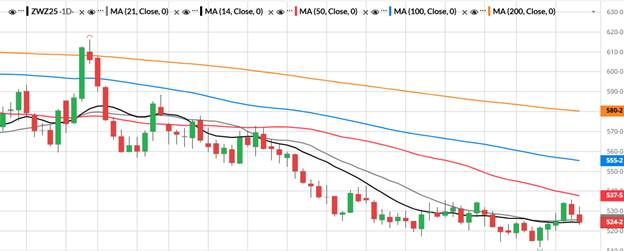
Fundamentals: December corn closed the day lower with small harvest delays but again the 6-10 day forecast appears to be trending drier. An interesting headline I saw today was that the China Customs Department stated that August corn imports were down 90% from last year! So again, we will continue to watch for some more headlines tomorrow from President Trump and Xi. Exports for corn this morning were also inline. With harvest pressure quickly approaching we will see how the market acts to a record corn crop about to be harvested. Trade Ideas: Long the December 410-450 call spread for 8½ cents. Daily ZWZ5: December wheat also closed the day lower and settled right on the 14-day moving average of 524 ¼. Additional support comes in at 512 which is the contract low in December wheat. For resistance we have 535 ¾ which is yesterday's high then followed by the 50-day moving average of 537 ½. (see chart below).
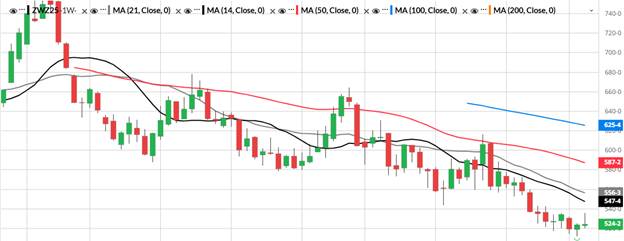
Weekly ZWZ5: Looking at the weekly charts for December wheat, we have resistance at 547 ½ which is the 14-day moving average and for support the contract low of 512. (see chart below).
Fundamentals: Wheat exports came in on the lower end of expectations this morning as well as private analyst raising the Russian production numbers yesterday. There is definitely not a shortage of global wheat supplies, and the recent rally could have been technical related when we got above the 525 level in the December contract. Trade Ideas: Long the 530 – 570 Dec call spread for 9 cents. If you would like to receive more information on the commodity markets or would like to open an account, please click the link Sign Up Now
Jon Wiedeman Pure Hedge Division Direct: 1 312 957 8108 WALSH TRADING INC. 311 S. Wacker Suite 540 Chicago, Illinois 60606 Walsh Trading, Inc. is registered as a Guaranteed Introducing Broker with the Commodity Futures Trading Commission and an NFA Member.
All information, communications, publications, and reports, including this specific material, used and distributed by Walsh Trading, Inc. (“WTI”) shall be construed as a solicitation for entering into a derivatives transaction. WTI does not distribute research reports, employ research analysts, or maintain a research department as defined in CFTC Regulation 1.71. This article contains syndicated content. We have not reviewed, approved, or endorsed the content, and may receive compensation for placement of the content on this site. For more information please view the Barchart Disclosure Policy here.
|
|
|