
|
|
|
|
Name
Cash Bids
Market Data
News
Ag Commentary
Weather
Resources
|
With Google Stock at $3 Trillion, Here’s How to Embrace the Rally but Protect the House/Alphabet%20Inc_%20and%20Google%20logos%20seen%20displayed%20on%20a%20smartphone%20by%20IgorGolovniov%20via%20Shutterstock.jpg)
If you’ve been reading my work here for a while, first of all, thank you. And if you have, you probably saw that headline and thought “ah, another interesting stock to collar if I own it.” In the case of Alphabet, also known as Google (GOOG) (GOOGL), you’re half right. Or is it two-thirds right? You can decide after I explain below. Here it is, Alphabet stock at $3 trillion in market capitalization, and then some. It recently became the fourth company to cross that threshold. And that is something the me of 15 or 20 years ago would have never thought I’d write in my lifetime. But here we are. And many traders and investors are much better off for it. 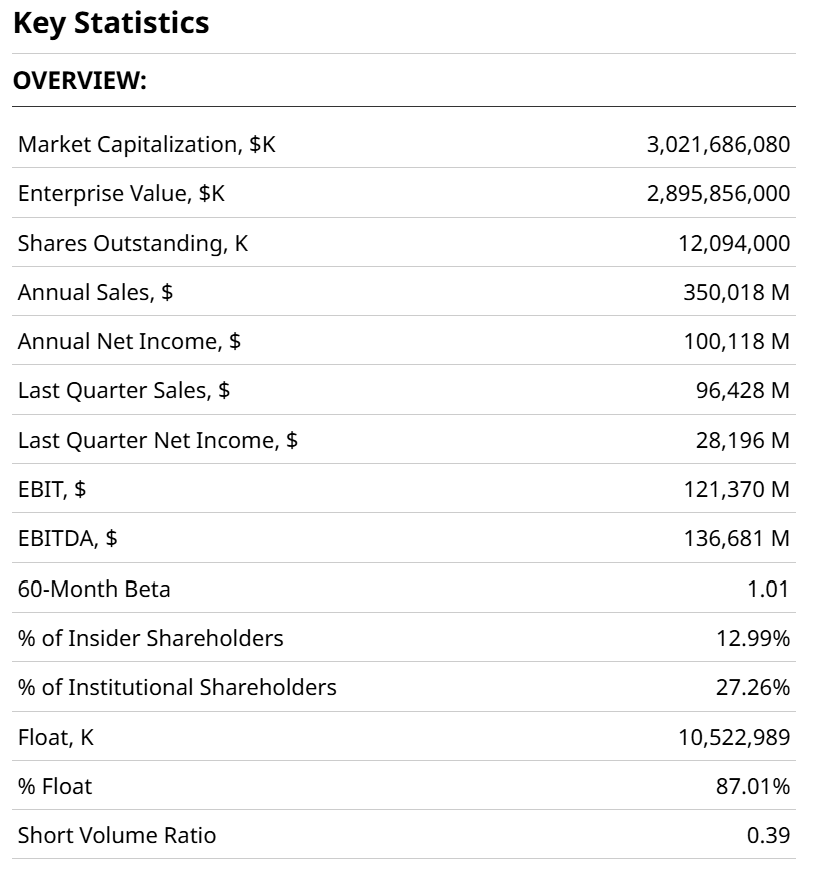 Before we leave that table above, also note that the 5-year trailing beta on Google is 1.01x. In other words, it has done this well, yet been only as volatile as the broader S&P 500 Index ($SPX). GOOG and GOOGL: Doing the MathTo solve any possible confusion, Alphabet has for many years traded as two separate ticker symbols, GOOGL and GOOG. These represent Class A voting shares (GOOGL) and Class C non-voting shares (GOOG). Like I said, an admin hiccup to say the least. So to be clear, that $3 trillion is the whole value of the parent company, which represents a combined 4.7% of the S&P 500. 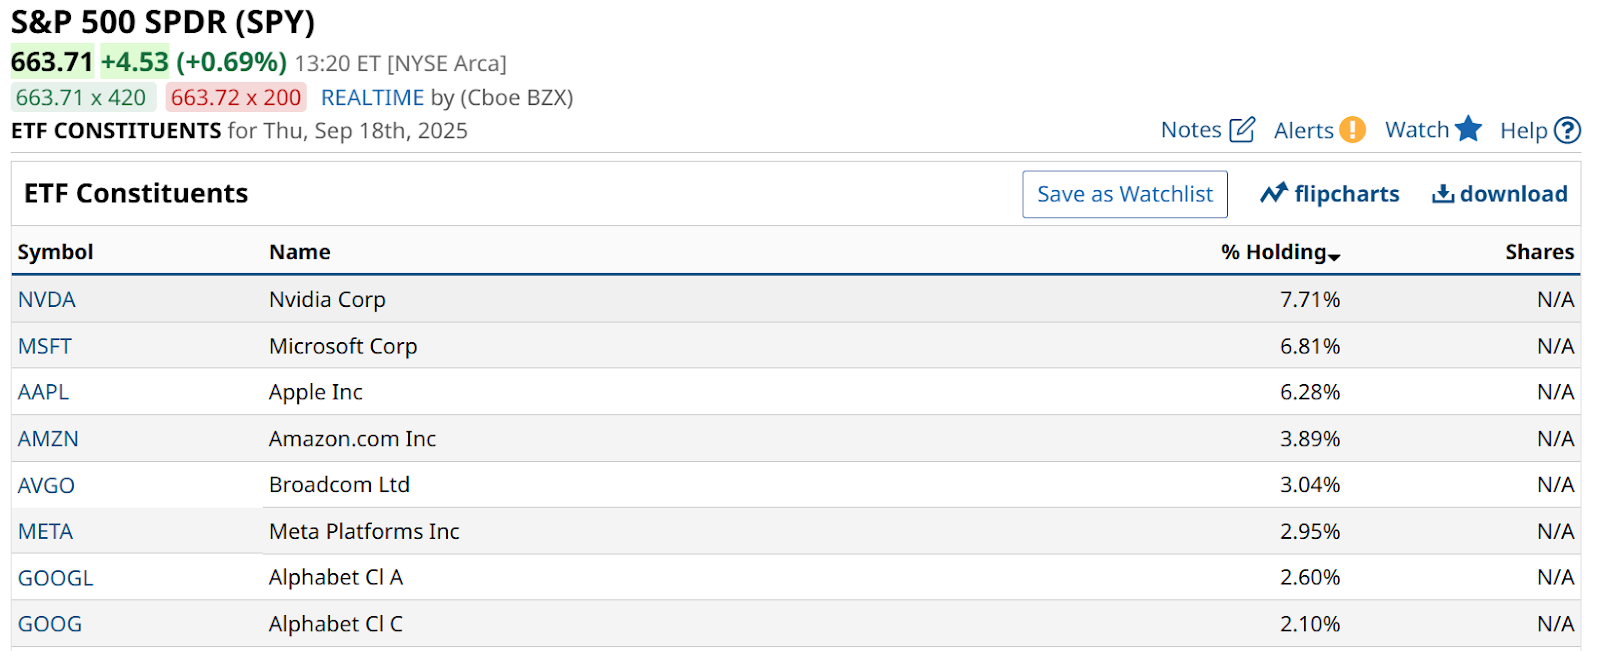 Let’s take a look at the charts, using only GOOG for simplicity. GOOG is flying. It is also showing some weariness, via a potentially toppy Percentage Price Oscillator (PPO) indicator at bottom in this daily chart below. 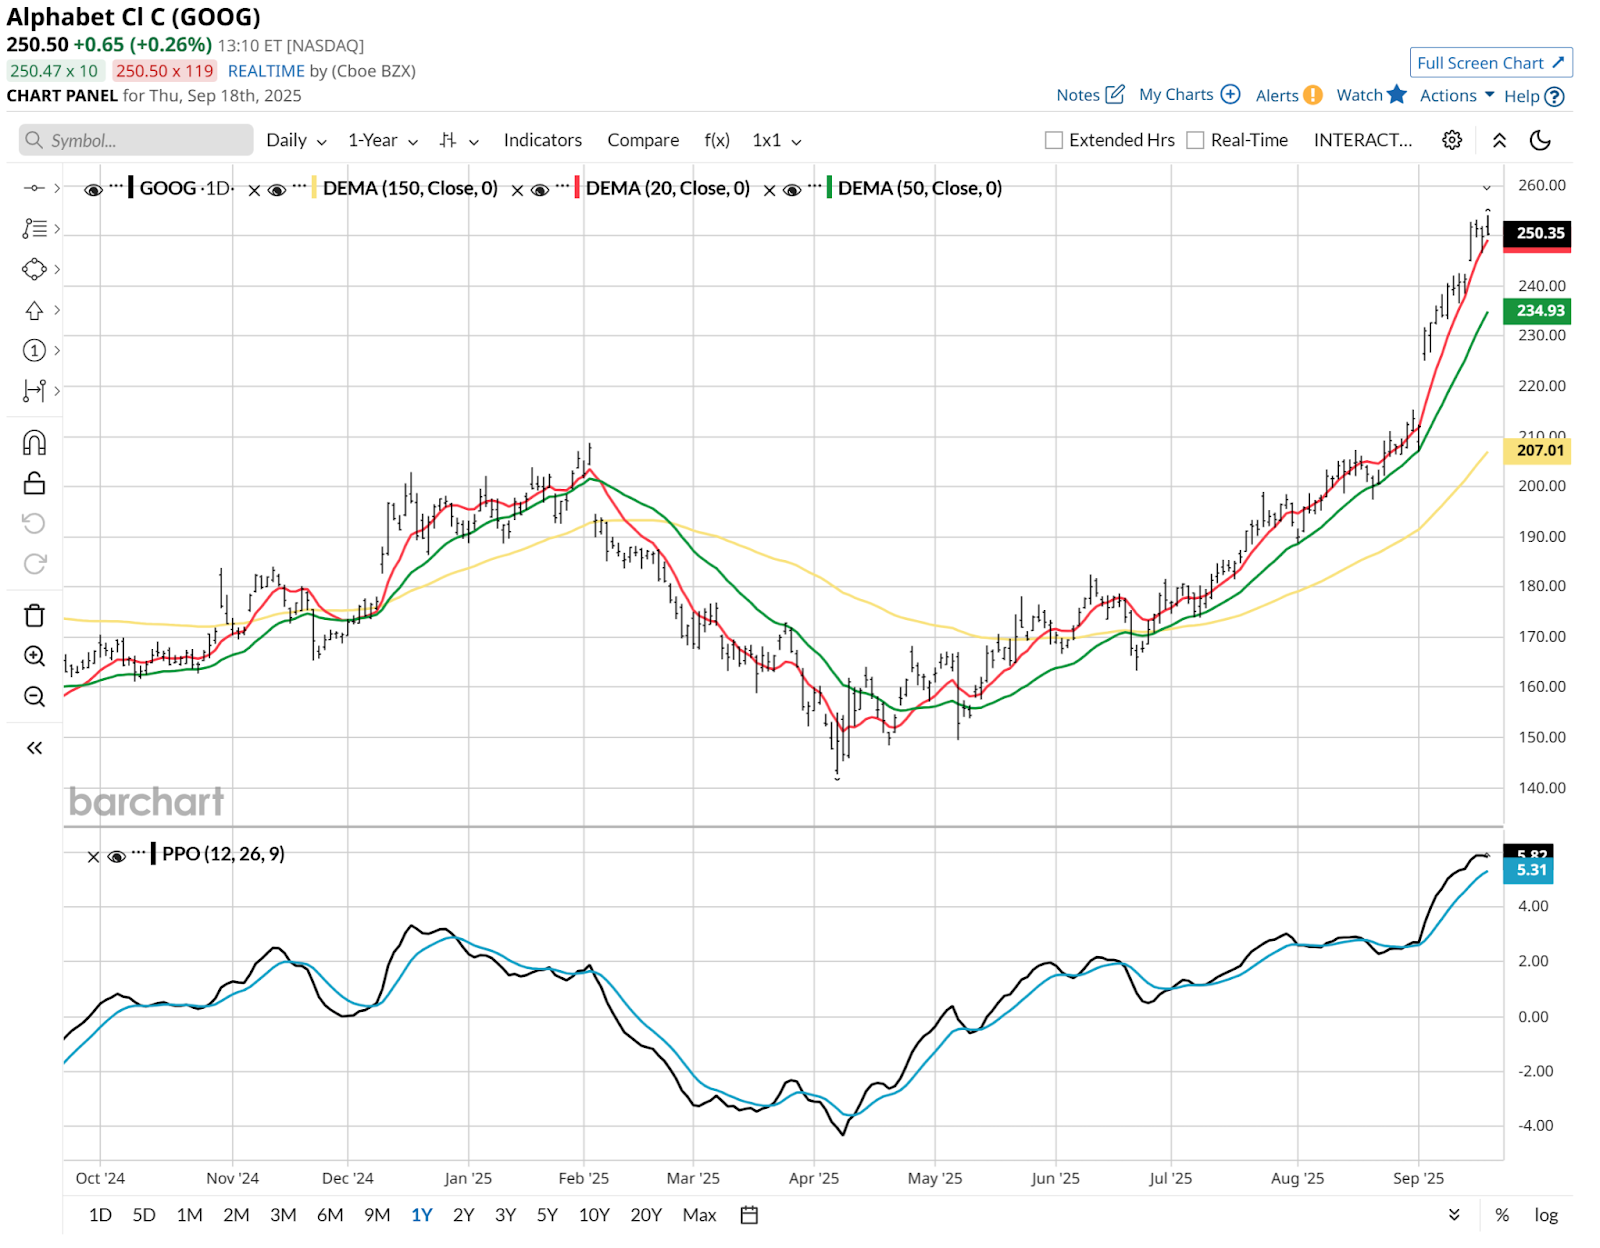 I might normally show both a weekly and monthly chart here. But I’ve essentially combined those ideas into one chart. Barchart’s tools make it so easy to just stretch out the weekly view to 10 years, which allows me to go back to just after this ticker started trading. 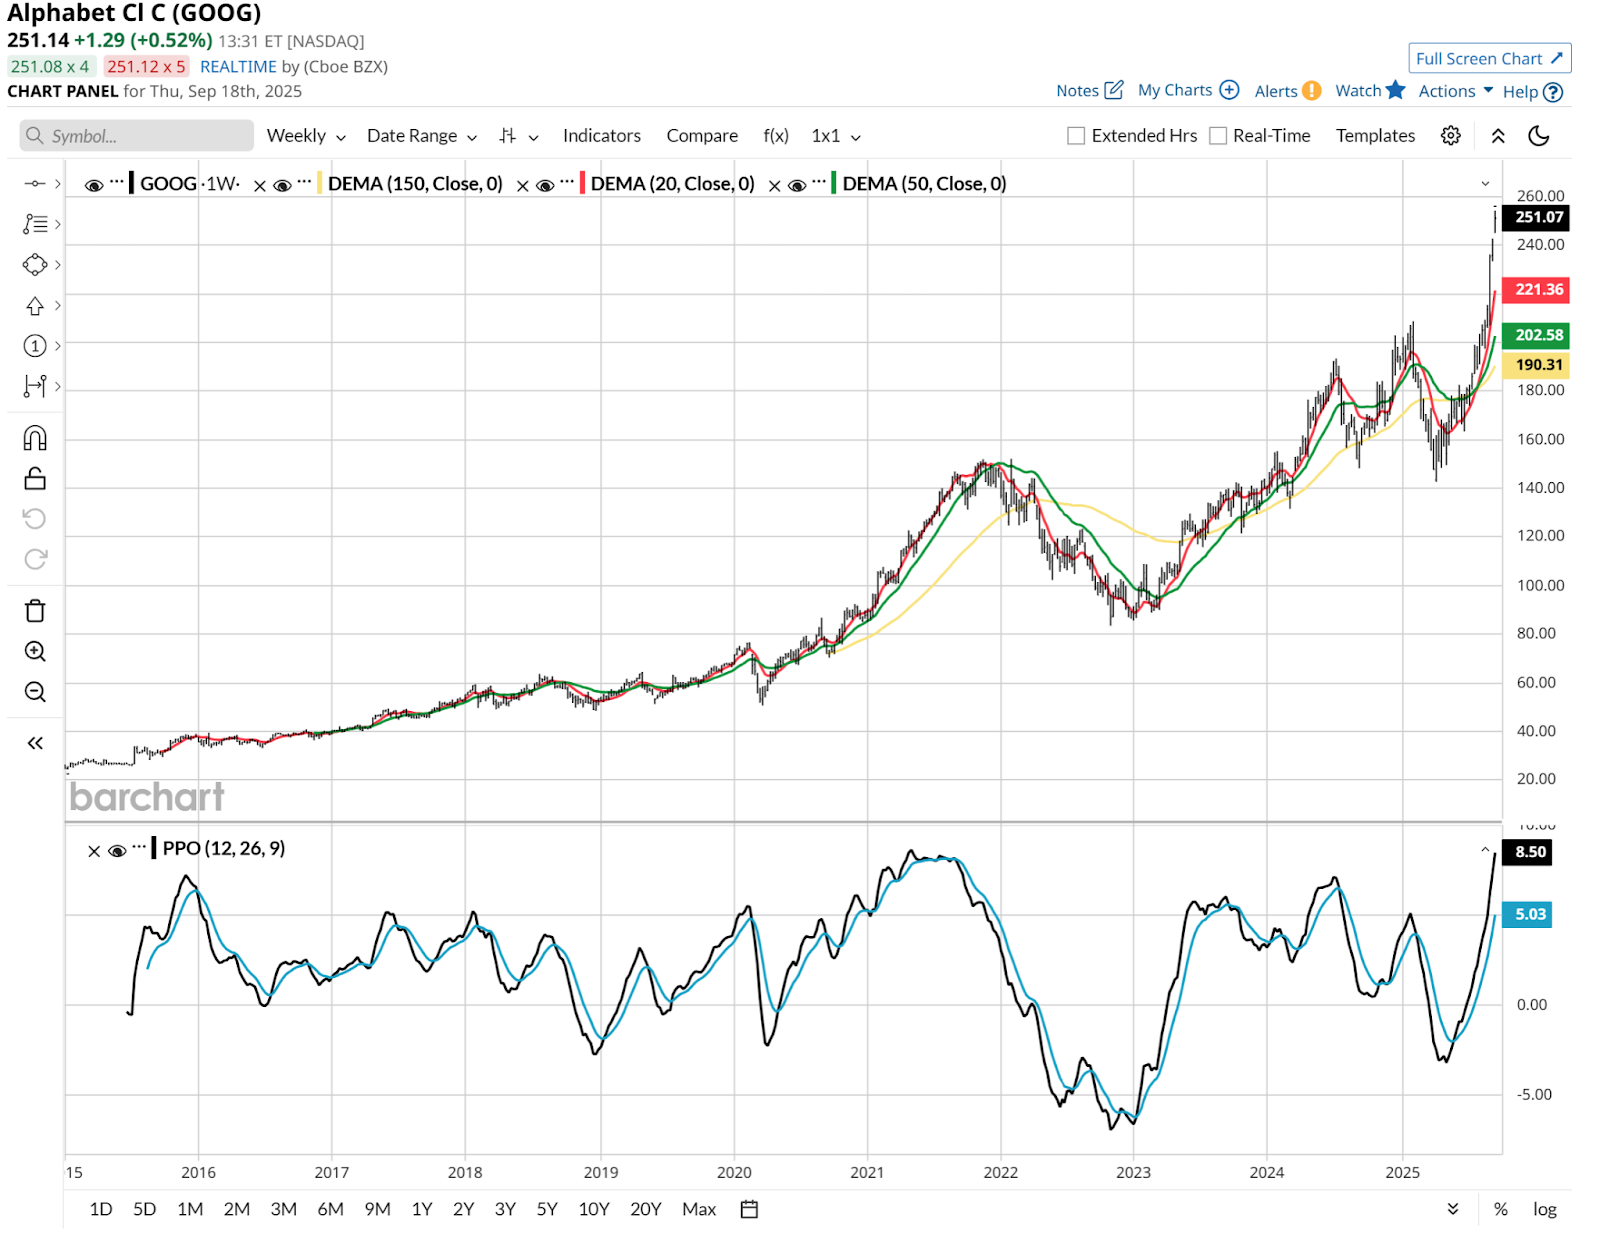 And that allows me to show just how high the stock is, in terms of technical “valuation.” I could also use the word “strength” to describe how the PPO has surged from negative territory to matching its 2021 level. A short time later, the stock slowed, but continued rising. But by the start of the following year, 2022, the move was over, for GOOG and the rest of the stock market. GOOG: Optimism Is Greater, But Risk Management Is BetterThis stock is a microcosm of a continued knee-jerk reaction by investors, both retail types pouring money into index funds, and hedge fund managers trying to play catch up, which is common this time of year. I’m not one to try to make a living predicting the future. Many try, and I wish them well. For me, this is about risk management. And that means combining a GOOG position (if I owned one) with a “friend” from the options market. Normally, I’d say “collar it” and show you something like this. A collar that gets me into next year (January 16, 2026 expiration), protects me below $235, allows upside to $300, and costs me only 2%, so my break-even on the stock is $255. That produces a more than 2:1 upside/downside ratio (18% to 8%). That’s some good risk management right there! 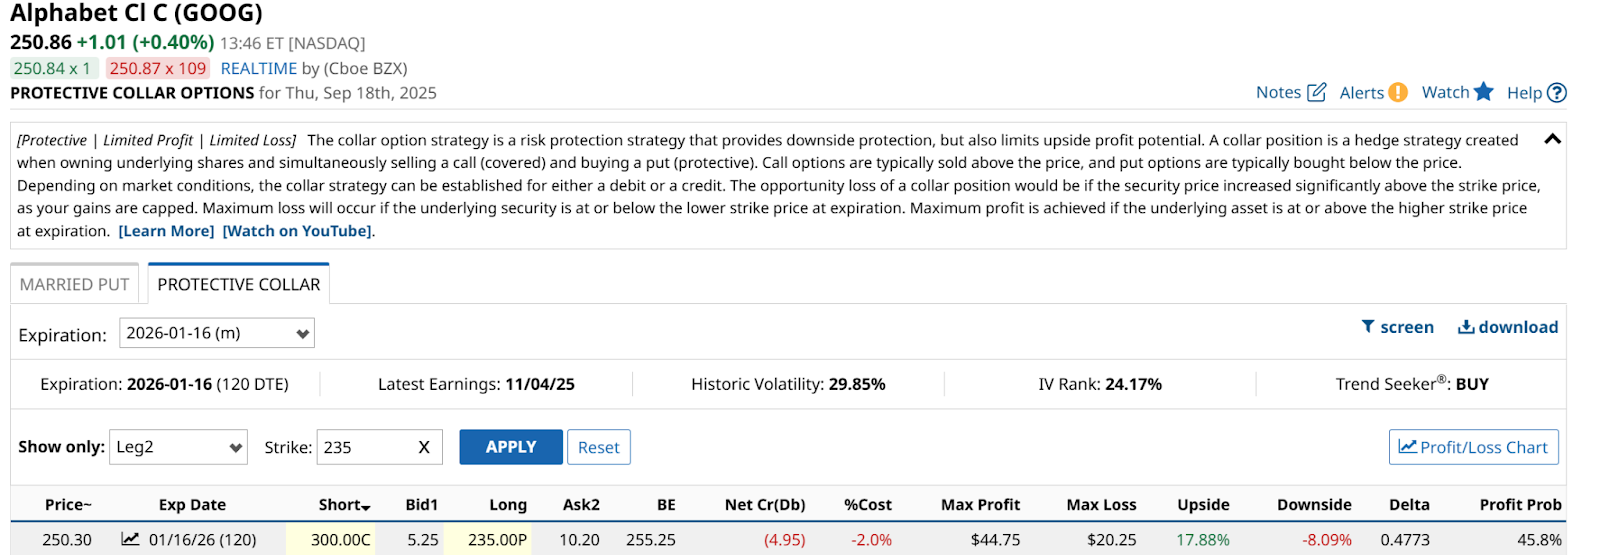 However, I tend to want to limit my losses on a collar to 5%, worst-case, come heck or high water. So if 8% were too high, the other route is to simply buy the puts and leave the covered calls for now. That could be as simple as deploying the put contract shown above. But that would allow for even more downside, since I would not have the modest call option premium I receive for giving up the upside above $300 during the next 4 months. That’s why I’m also showing what that might look like. Below, using Barchart’s “Married Put” option tool, I found a GOOG put option to that same expiration date. 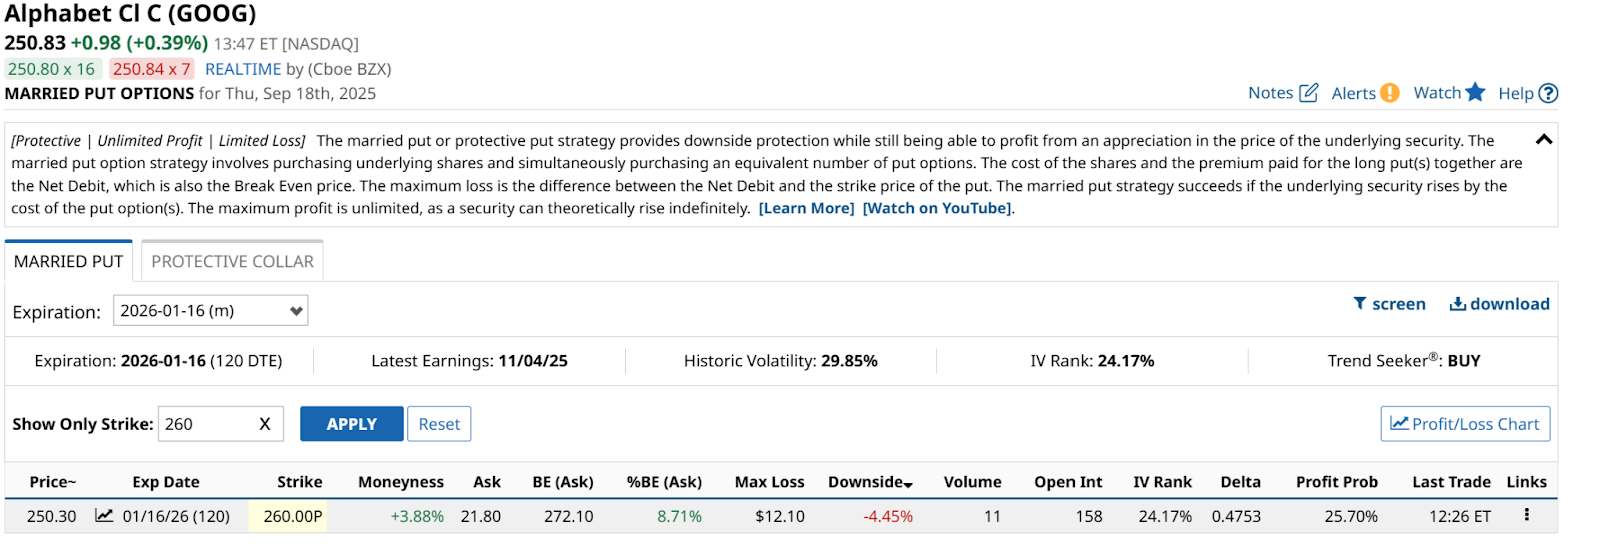 I achieve my goal of no more than 5% downside risk (4.45% here). And my upside is unlimited, since I have no covered call option. Options are nearly always about the tradeoffs we are willing to accept. Here, the tradeoff is less downside, all the upside, versus the collar example earlier. That all sounds great, right? But of course, that tradeoff is there. In the form of a higher break-even point on the stock. Here it is all the way up at $272, versus $255 for the collar I showed. The Bottom Line on How to Trade Google Stock HereThis all comes down to personal preference. Not only on the tradeoffs above. To me, using options is merely a tool to get what I want from my chart work. Case in point, giving up $21 of upside ($272 break even versus $251 recent price) before covering the cost of the put option purchase (“married put”) sounds like a lot. But note this: GOOG rose by nearly $21 a share since Sept. 3. That was the first trading day AFTER its huge earnings-driven rally, that popped the stock $19 (9%) in a single day. All on the road to $3 trillion. Like I said, it is all about the degree to which one wants to manage risk alongside their pursuit of return. I’m a defense-first trader. You can learn who you are, or expand your flexibility as a trader, just by putting in the time and effort to master the vast set of tools at our disposal. On the date of publication, Rob Isbitts did not have (either directly or indirectly) positions in any of the securities mentioned in this article. All information and data in this article is solely for informational purposes. For more information please view the Barchart Disclosure Policy here. |
|
|